
blocks:dashboard:configplotting
Table des matières
Dashboard Block
Configuring the Graph Display
Graph type
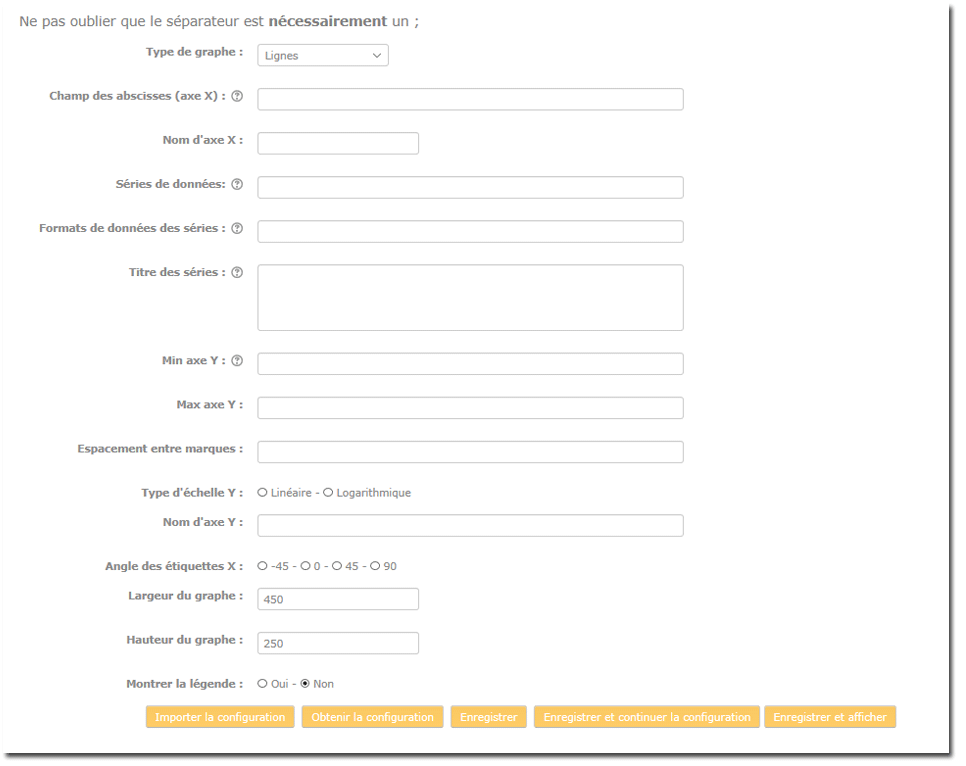
- Choose the graph type: Lines, Bars, donut, pie chart, time curve, time data, Google Map
 Some graphs may display additional settings panels.
- X-axis field (abscissa): Define the abscissa field - Example: month
- X-axis name: Name of the axis - Example: Month
- Data series: Example: cnx Depending on the graph type, one or more series can be defined for display. Data series must be output column names (or their aliases) and must be separated by “;”. Series names can be defined in the Series title area as a list of mentions separated by “;”. See further down this page under Series title.
- Special functions on output series If a data series is expressed as S (column_name), then the values are accumulated in the display order of the output.
- Series data format: Example: %d - See Output data format
- Series title: * When you display several data series in a graph (or display a pie chart or a donut). Series take by default the name of the X-axis (abscissa) values. You can use this field to provide alternative labels for the X-axis values. The list must show the labels in the order in which the abscissa values arrive.
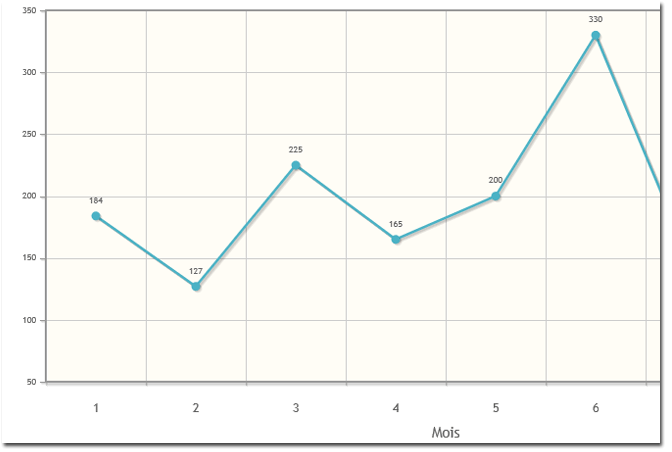
- Y-axis Min and Y-axis Max: Normally, graph production automatically calibrates the Y axis according to the data to display. You can however impose the calibration of the axes by defining one of the min or max parameters. The grapher may nevertheless sometimes make certain decisions beyond your indications.
Example: Y-axis Min: 50
- Y scale type: Choose between Linear or Logarithmic
Series title: Enter the title(s) of your choice for the series in the text area, separated by ;
- Y-axis name: Enter the name of your choice for the ordinate axis in the text area
- X label angle: Choose the orientation angle of the abscissa axis texts
- Graph width and Graph height: Enter the value in pixels for the width and height of the graph
Example: 850 for the width and 450 for the height
- Show legend: Choose between Yes or No (default value)
Credits
- Valéry Frémaux (valery@activeprolearn.com)- Development and documentation
- Florence Labord (florence@activeprolearn.com) - documentation
Back to the configuration guide index - Back to the component index - Go to the generic query catalog - Back to the plugin index - Back to the catalog
blocks/dashboard/configplotting.txt · Dernière modification : de 127.0.0.1