Table des matières

Training Sessions Report (Learning time): User guide: Grades
Adding the course grade
This adds the grade shown in the gradebook as illustrated below:
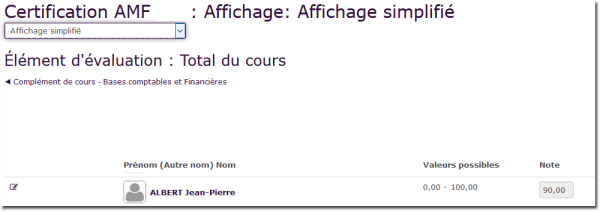
To add the course grade to the TS report
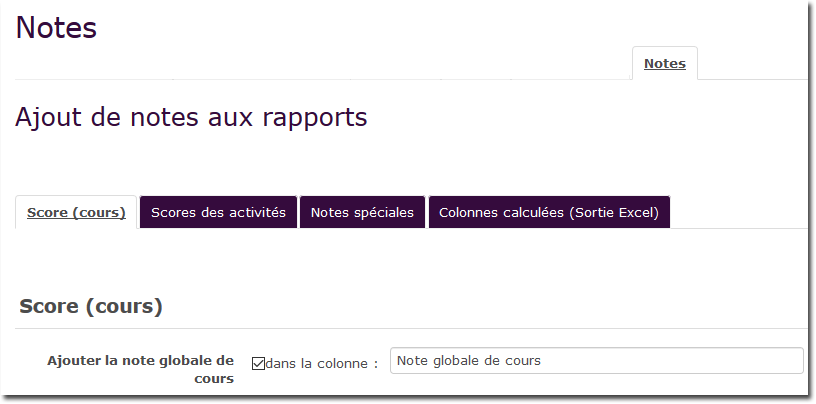
- Path: Course administration/Report/trainingsession/grade tab
- Tab: Score (course)
- Add the global course grade: Check the box
- In the column: Column name of your choice
Activity scores
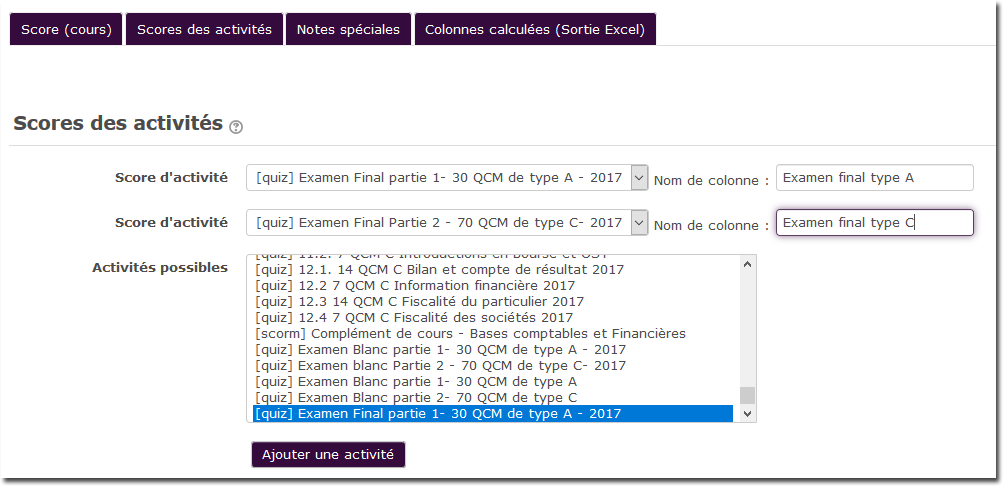
You can choose the graded activities (quiz, SCORM) whose grade(s) you want to display in the Training Session report.
- Path: Course administration/Report/trainingsession/grade tab
- Tab: Activity scores
- Select the activities whose output you want
- For each of them, give an output column name
Special grade
A special grade can be added. This special grade can be of two kinds:
- Linked to time spent, from the calculations provided to Training Sessions by Usestat, which will add a grade in the report
- In the form of a grade bonus, which is added to the course grade. For this second point, it is therefore necessary to keep in mind the maximum grade that can be obtained on a course.
Output values:
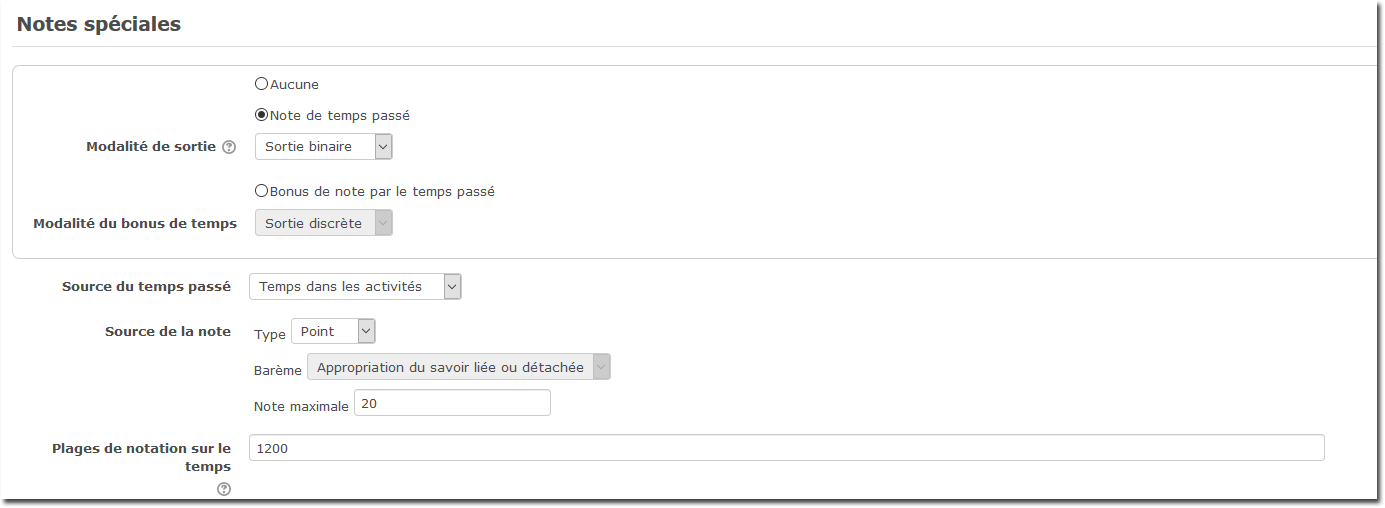
- Binary (when possible): A single threshold is expected, which determines the switch between a null grade and the award of the maximum grade. If the grade is based on a scale, the given grade will switch between the first and the last index of the scale.
- Discrete: A series of thresholds is expected, which separate the input data space into ranges. The maximum grade is divided into grade ranges of equal width (give or take rounding) over the number of available intervals. If a scale is used, you must provide N - 1 thresholds (N being the number of items in the scale).
- Continuous: A reference value equivalent to the full grade is expected. A value above it gives the maximum grade. A lower value gives the closest whole portion of the grade to the “actual value / reference value” ratio.
Source of time spent:
- Total time in the course: Time spent in the whole course.
- Time spent (extended): Time spent in the course and in out-of-course spaces.
- Time in activities: Time spent only in activities.
Grade source:
- Scale: uses the scale creation of Moodle
- Points: uses the point grading of the gradebook
Grading range on time:
Defining grading ranges lets you split the “time spent” quantity into discrete grading intervals.
- In “binary” mode, enter a single threshold value (in minutes). The training session report will display the generated “Time grade”.
- In “Discrete” mode, enter a comma-separated list of times expressed in minutes. With N thresholds, you define N+1 intervals. The last interval stands for “above”. The training session report will display the grades matching the scale labels.
Example of a special grade awarded on 20 hours spent in activities
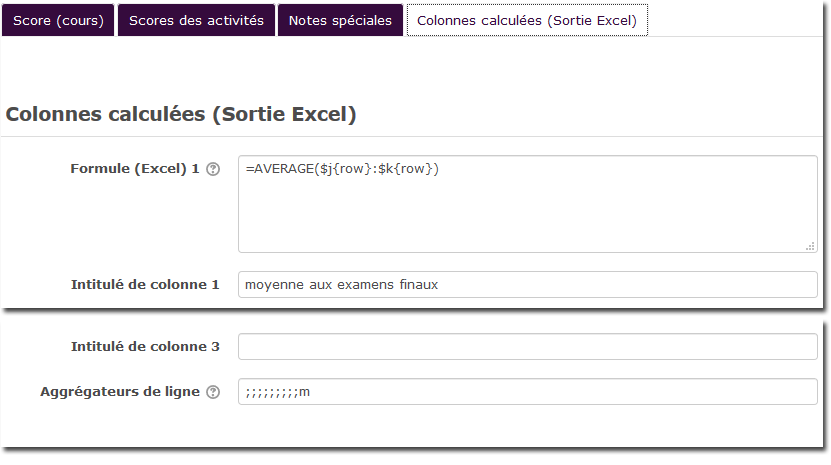
Calculated columns (Excel output)
Extraction of summary lists, the Excel formulas to use:
Note: Works for reports of type Summary per participant or All courses
- XLS Average formula:
Use the {minrow} and {maxrow} placeholders to frame the calculation range and {col} for the current column reference. Example cells: ${col}$3 or $Y${minrow} - Default: =AVERAGE({col}{minrow}:{col}{maxrow})
- XLS sum formula:
Use the {minrow} and {maxrow} placeholders to frame the calculation range and {col} for the current column reference. Example cells: ${col}$3 or $Y${minrow} - Default: =SUM({col}{minrow}:{col}{maxrow})
Example of average grade calculated in row and in column 10.
Back to the user guide - Back to the component index - Back to the plugins index - Back to the catalogue