Table des matières

Training Time Report (TrainingSessions): Technical guide: settings
The component settings are found in the site administration. The time calculation settings (inactivity threshold, last ping credit, one session per course, ignored modules…) are not carried by this component: they are those of the Use Stats block.
Access path
- Path: Site administration / Reports / Training sessions
Sessions
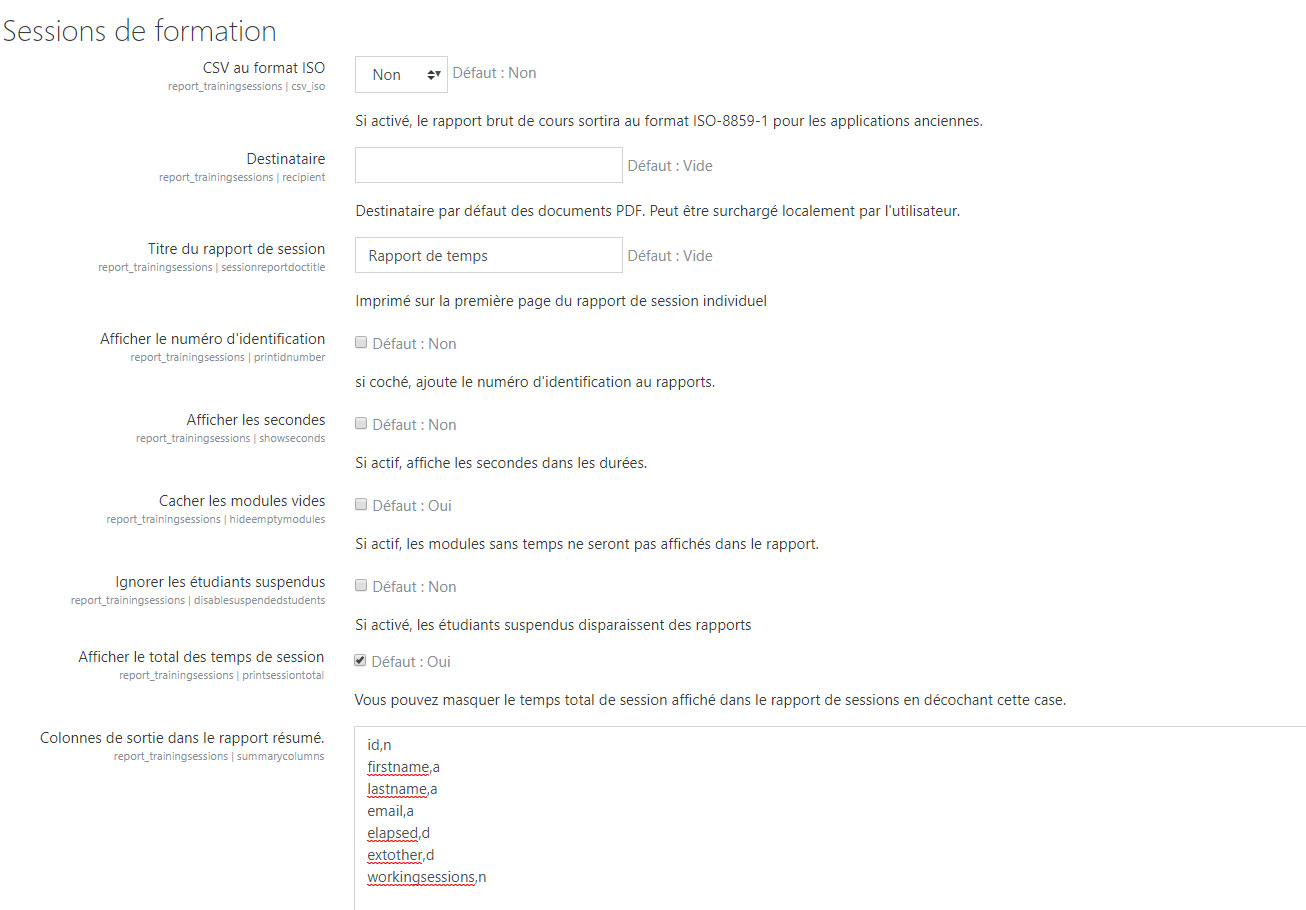
The options in this part set the general content of the reports.
- CSV encoding: encoding of the produced CSV files (UTF-8 by default, or ISO for older Excel versions).
- Recipient and Session report title: default recipient of deferred reports, and title printed on the first page of the individual session report.
- Show identification number, Show seconds, Show training location, Show session total: display options in the reports.
- Hide modules without time (yes by default): modules without any activity are not listed.
- Default start date: start date of a report period - course start (default), account creation, or user enrolment date.
- Exclude suspended enrolments / users: removes suspended enrolments or users from the report (no by default).
- Show completion (yes by default): adds the completion state in the individual reports.
- Additional user information: two profile fields to add to the reports. For new setups, prefer the
profile_field_shortnamekeys in the column list. - Deletion of old reports: age (in days) beyond which reports generated by deferred tasks are deleted. The value 0 (default) keeps files indefinitely: nothing is deleted. Deletion is performed every night by the Delete old reports scheduled task.
Output columns of the summary report:
The Output columns in the summary report setting contains one column per line, in the form key,format. The columns active by default are: identifier, identification number, first name, last name, email, last course access, time spent in activities, time out of course structure, time spent in the course, complementary times, number of working sessions.
For the definition of each column, the formats n, a, t and d, how to disable a column with # and per-course customisation, see the Output columns list page.
Grades
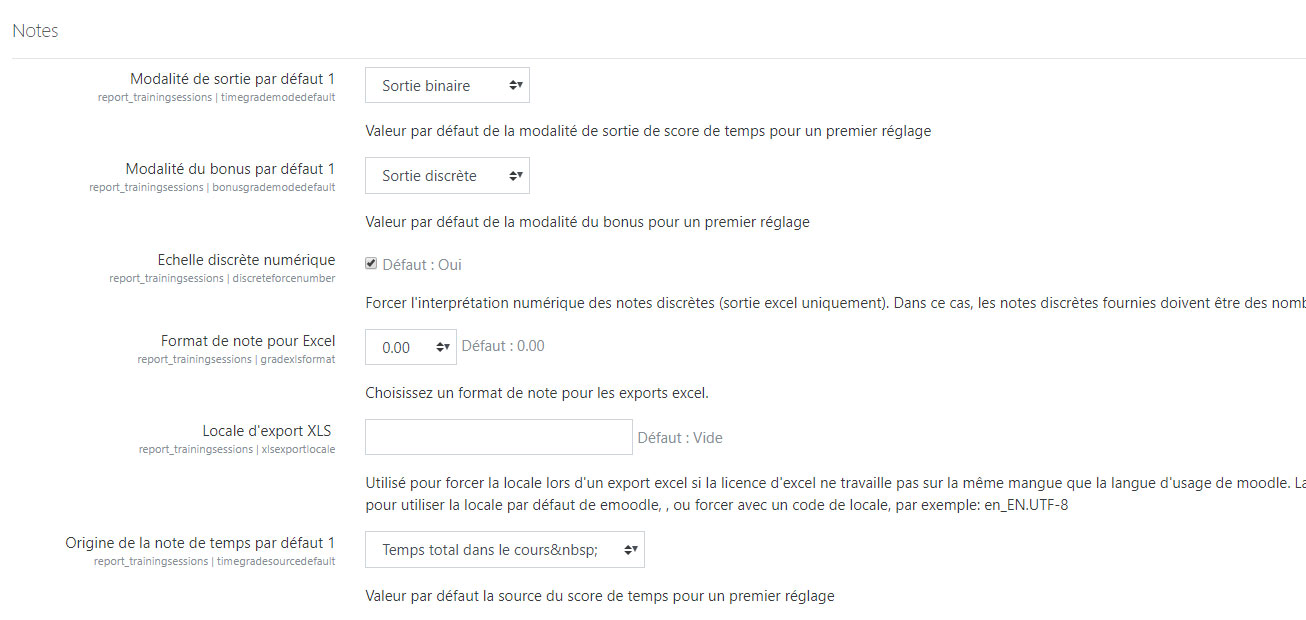
This part sets the calculation and export of grades in the reports (Grades tab).
- Time grade calculation mode and Bonus grade calculation mode: modes offered by default in the grade settings form of a course.
- Time source for grades: time source used by default for the time grade.
- Force discrete values (yes by default): rounds grades to integer values.
- Grade format for Excel: number of decimals in Excel exports (integer, one or two decimals).
- Excel export locale: lets you force the locale during an Excel export if the Excel version is not in the language Moodle is used in. Leave empty to use the default Moodle locale.
Colours
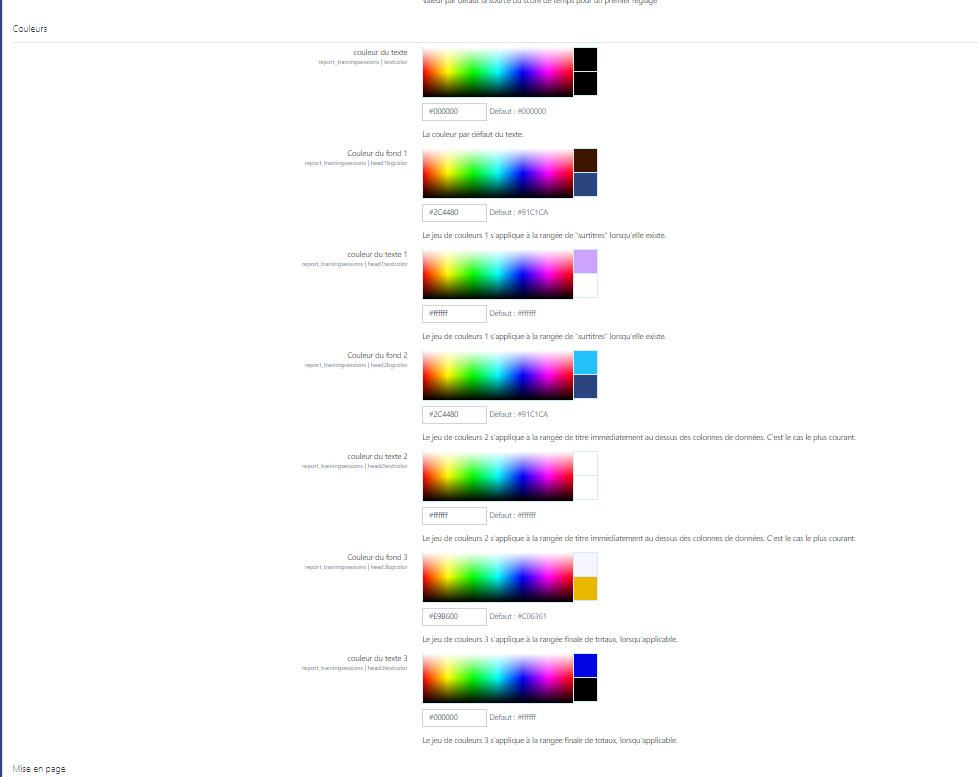
This part lets you set the colours that will appear on your PDF reports. Seven colours can be set:
- Text colour: colour of the general text of the document (black by default).
- Background colour 1 and text colour 1: background and text colours of the column header (blue-green and white by default; dark blue and white in the example at the bottom of the page).
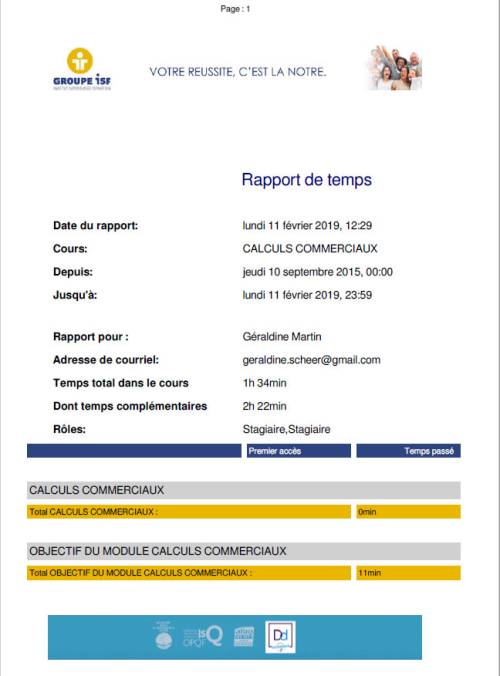
- Background colour 2 and text colour 2: background and text colours of the detail lines (grey in the example at the bottom of the page).
- Background colour 3 and text colour 3: background and text colours of the section total lines (brick red and white by default; light blue in the example at the bottom of the page).
Layout
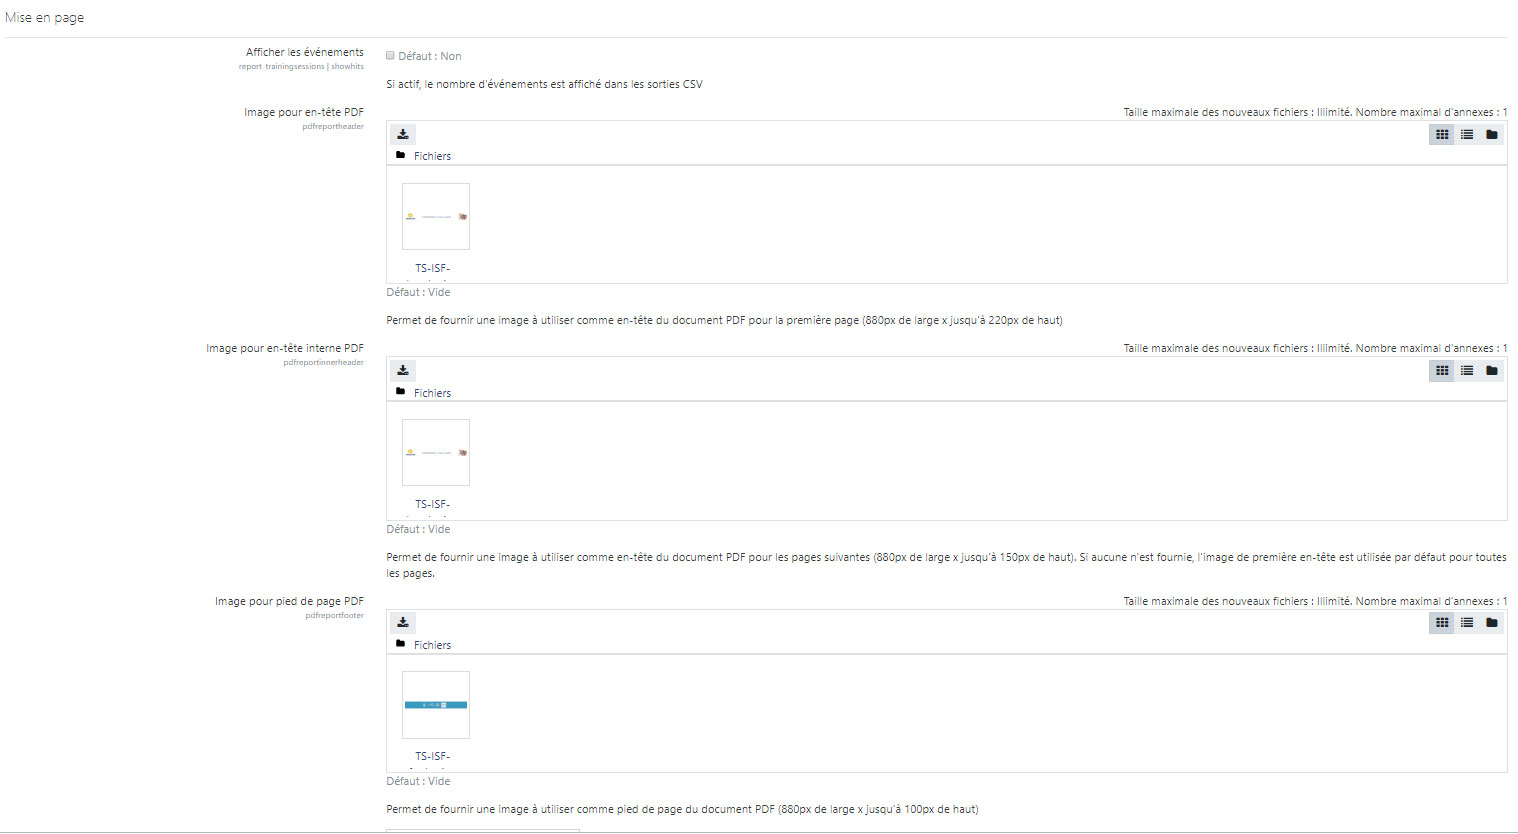
Event and item columns: the Show events (hits), Show sessions, Show sections only, Show first access to items, Show last access to items and Show monthly quick reports boxes are all unchecked by default. The display of events (hits) is only filled for site administrators.
Graphic elements of PDF reports:
- Image for the report header (880 px wide, up to 150 px high)
- Image for the header of the following pages, if the report has several pages (880 px wide, up to 150 px high). Without an image, the first header image is used.
- Image for the footer (880 px wide, up to 100 px high)
- Absolute vertical offset: vertical start position of the PDF document content, in mm (70 by default, depends on the header size)
- PDF page height: height at which the page break is generated, in mm (225 by default, depends on the footer size)
Coupling
LTC coupling (PRO): if you enable this option, the pedagogical contract times indicated on activities and resources in the Pedagogical progress and time (LTC) component will be displayed on the reports, for the benefit of the user:
- the LTC time if the time spent by the user is shorter than the time marked through the LTC;
- the time measured by the session if the time spent by the user is longer than the time marked through the LTC.
The Session time clipping setting specifies what happens to the measured time when it exceeds the LTC time: with Mark, the measured value is kept and flagged; with Clip, it is limited to the LTC time.
Additional Excel functions (PRO)
These two formulas are added by default at the end of reports in Excel format:
- XLS average formula (by default
=AVERAGE({col}{minrow}:{col}{maxrow})) - XLS sum formula (by default
=SUM({col}{minrow}:{col}{maxrow}))
The {col}, {minrow} and {maxrow} markers are replaced by the column and the start and end rows of the computed range. Function names are the English Excel ones (AVERAGE, SUM).
Special multi-course report functions (PRO)
[[ To add: snapshot of the text area ]]
This text area lets you describe sets of courses for which an aggregated report (Pedagogical Programme report) will be available, from each report of the courses that make it up.
A “course group” or “Pedagogical Programme” is described in one line, by the Moodle ids of the courses that make it up, separated by commas (example: 12,15,18). One programme per line. The order of the ids is the display order of the courses in the report.
A course can only belong to one programme. If it appears in several lines, the first programme in which it appears is retained when you navigate the session report of this course. Invalid, null or duplicate ids are ignored.
In a multi-course report, enrolment dates are aggregated: the first enrolment date and the last end date.
Extensions (dedicated reports)
Sub-plugins of the Dedicated reports type (tscustom) have their own settings category, under that of the component.